This guide outlines the functionalities associated with Ascendix Search's analytics functionality. Users can create separate, independent dashboards with Ascendix Search's results to monitor key business metrics based on insights data.
Creating and Managing Dashboards
First, as an admin, you have to place the component Search Analytics on the flexipage. You can place it on your Home page or any other.

2. Click the Save button to apply changes.

Steps to Create a Dashboard
The Dashboard can be created either from the tab or from Ascendix Search. Let's explore those scenarios together!
Create a Dashboard from the tab:
- Start typing the Ascendix Search Dashboard in the App Launcher.

2. Click the New button and fill in the fields:
- Dashboard Name: Provide a unique and descriptive name for your Dashboard.
- Description: Provide a concise summary of the information and insights available on this Dashboard.


- Click the Save button.
Create a Dashboard from the Ascendix Search:
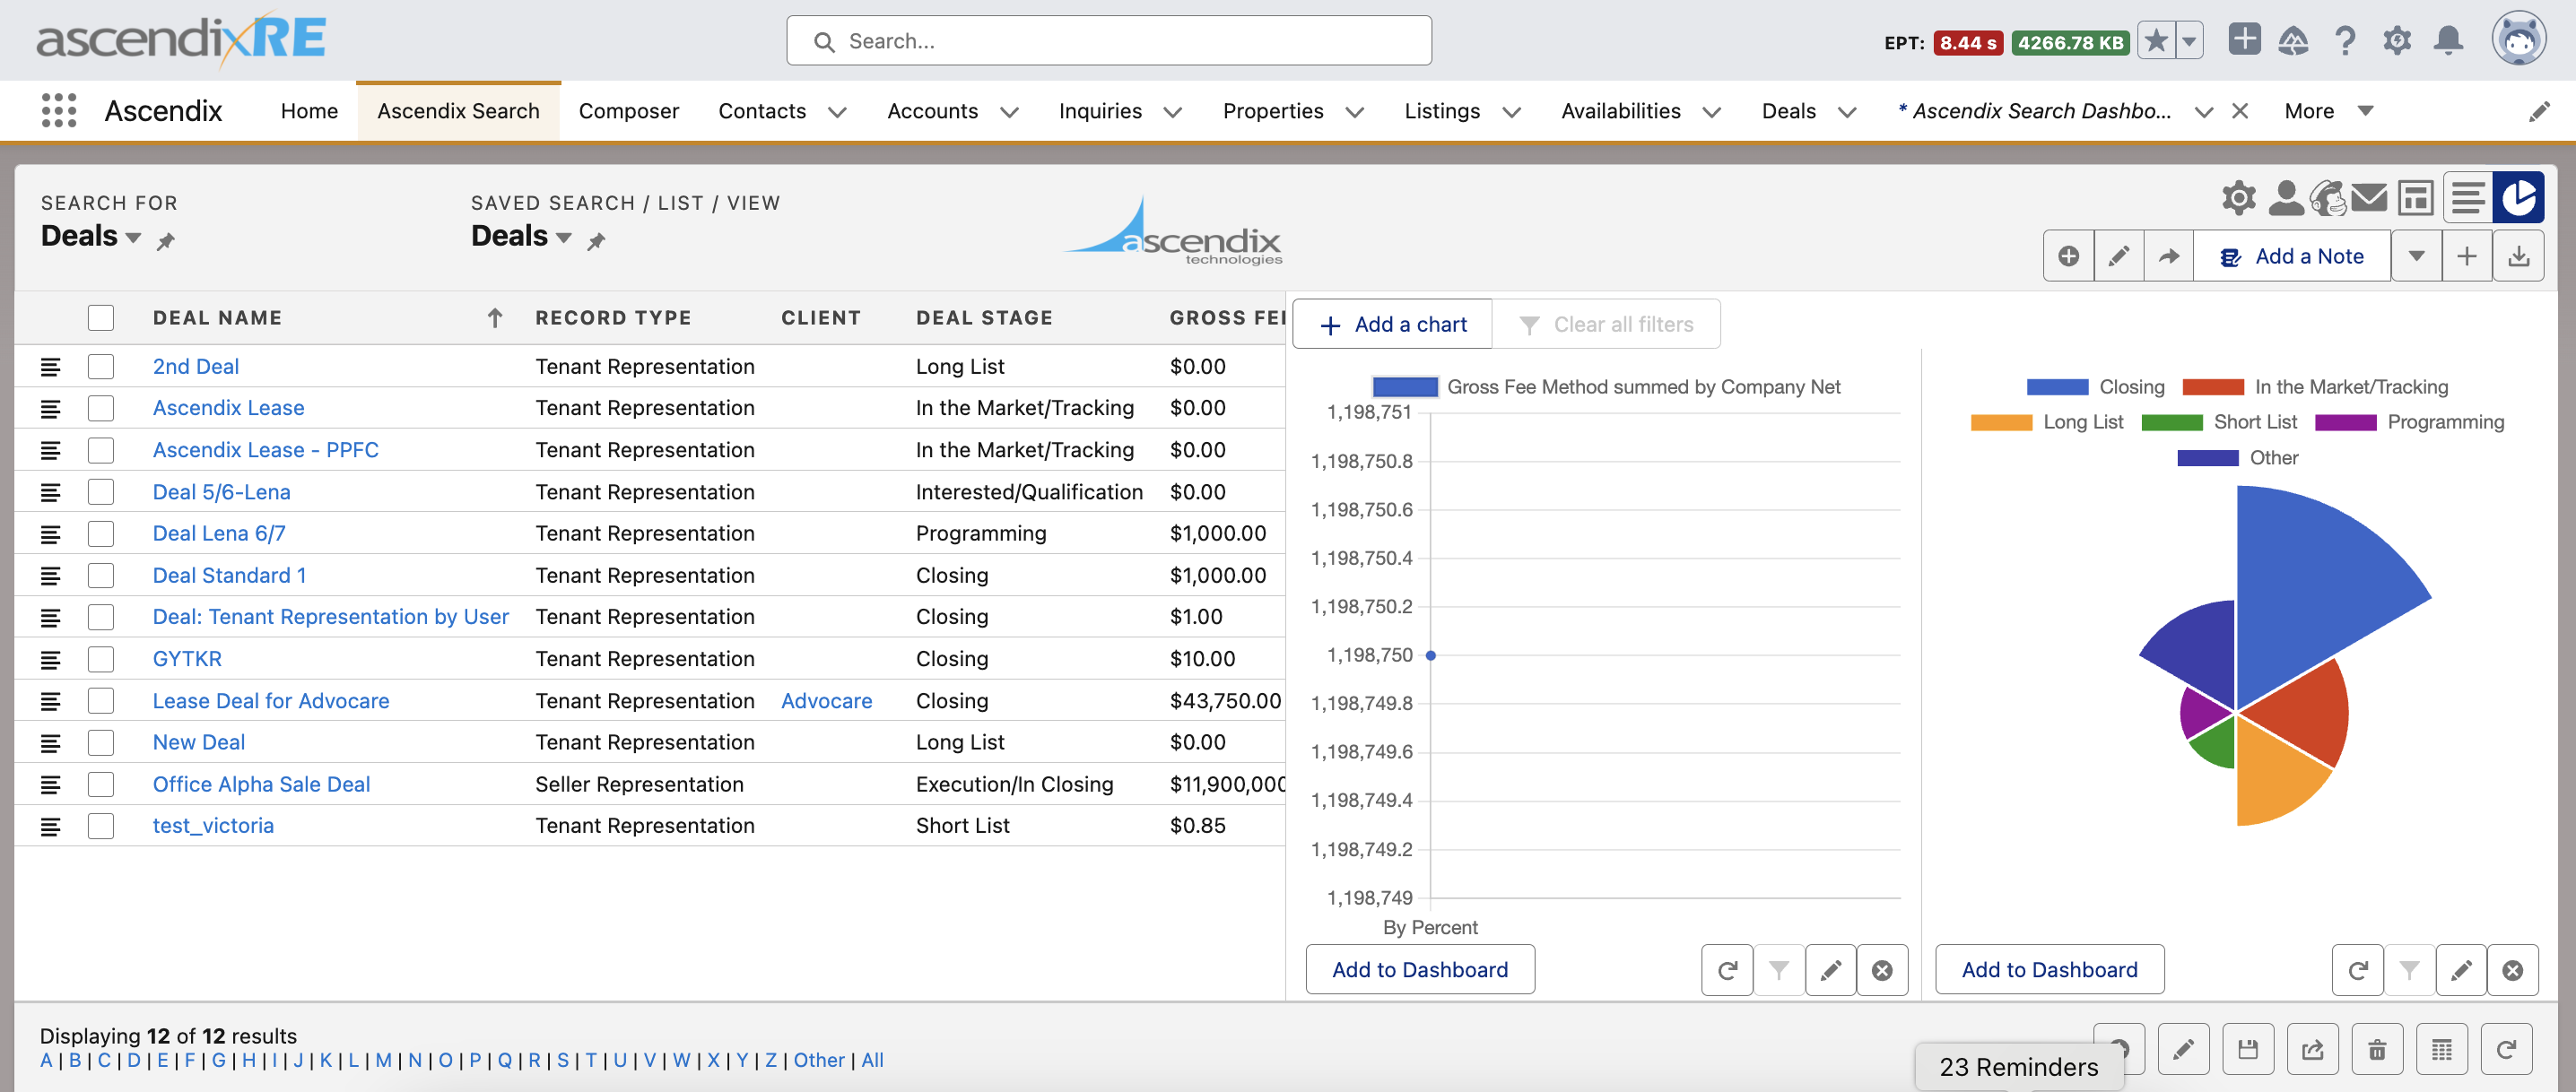
- Create/choose a search or a system view for which you want to create a chart for. Below, we have two charts based on the Deal records: Gross Fee Method summed by Company Net and Deal Stages.
note: if for System views Add to dashboard button is not shown, click on refresh icon the Ascendix Search dropdown list. - Create your charts and Save them. Make sure the Search result is saved as well.
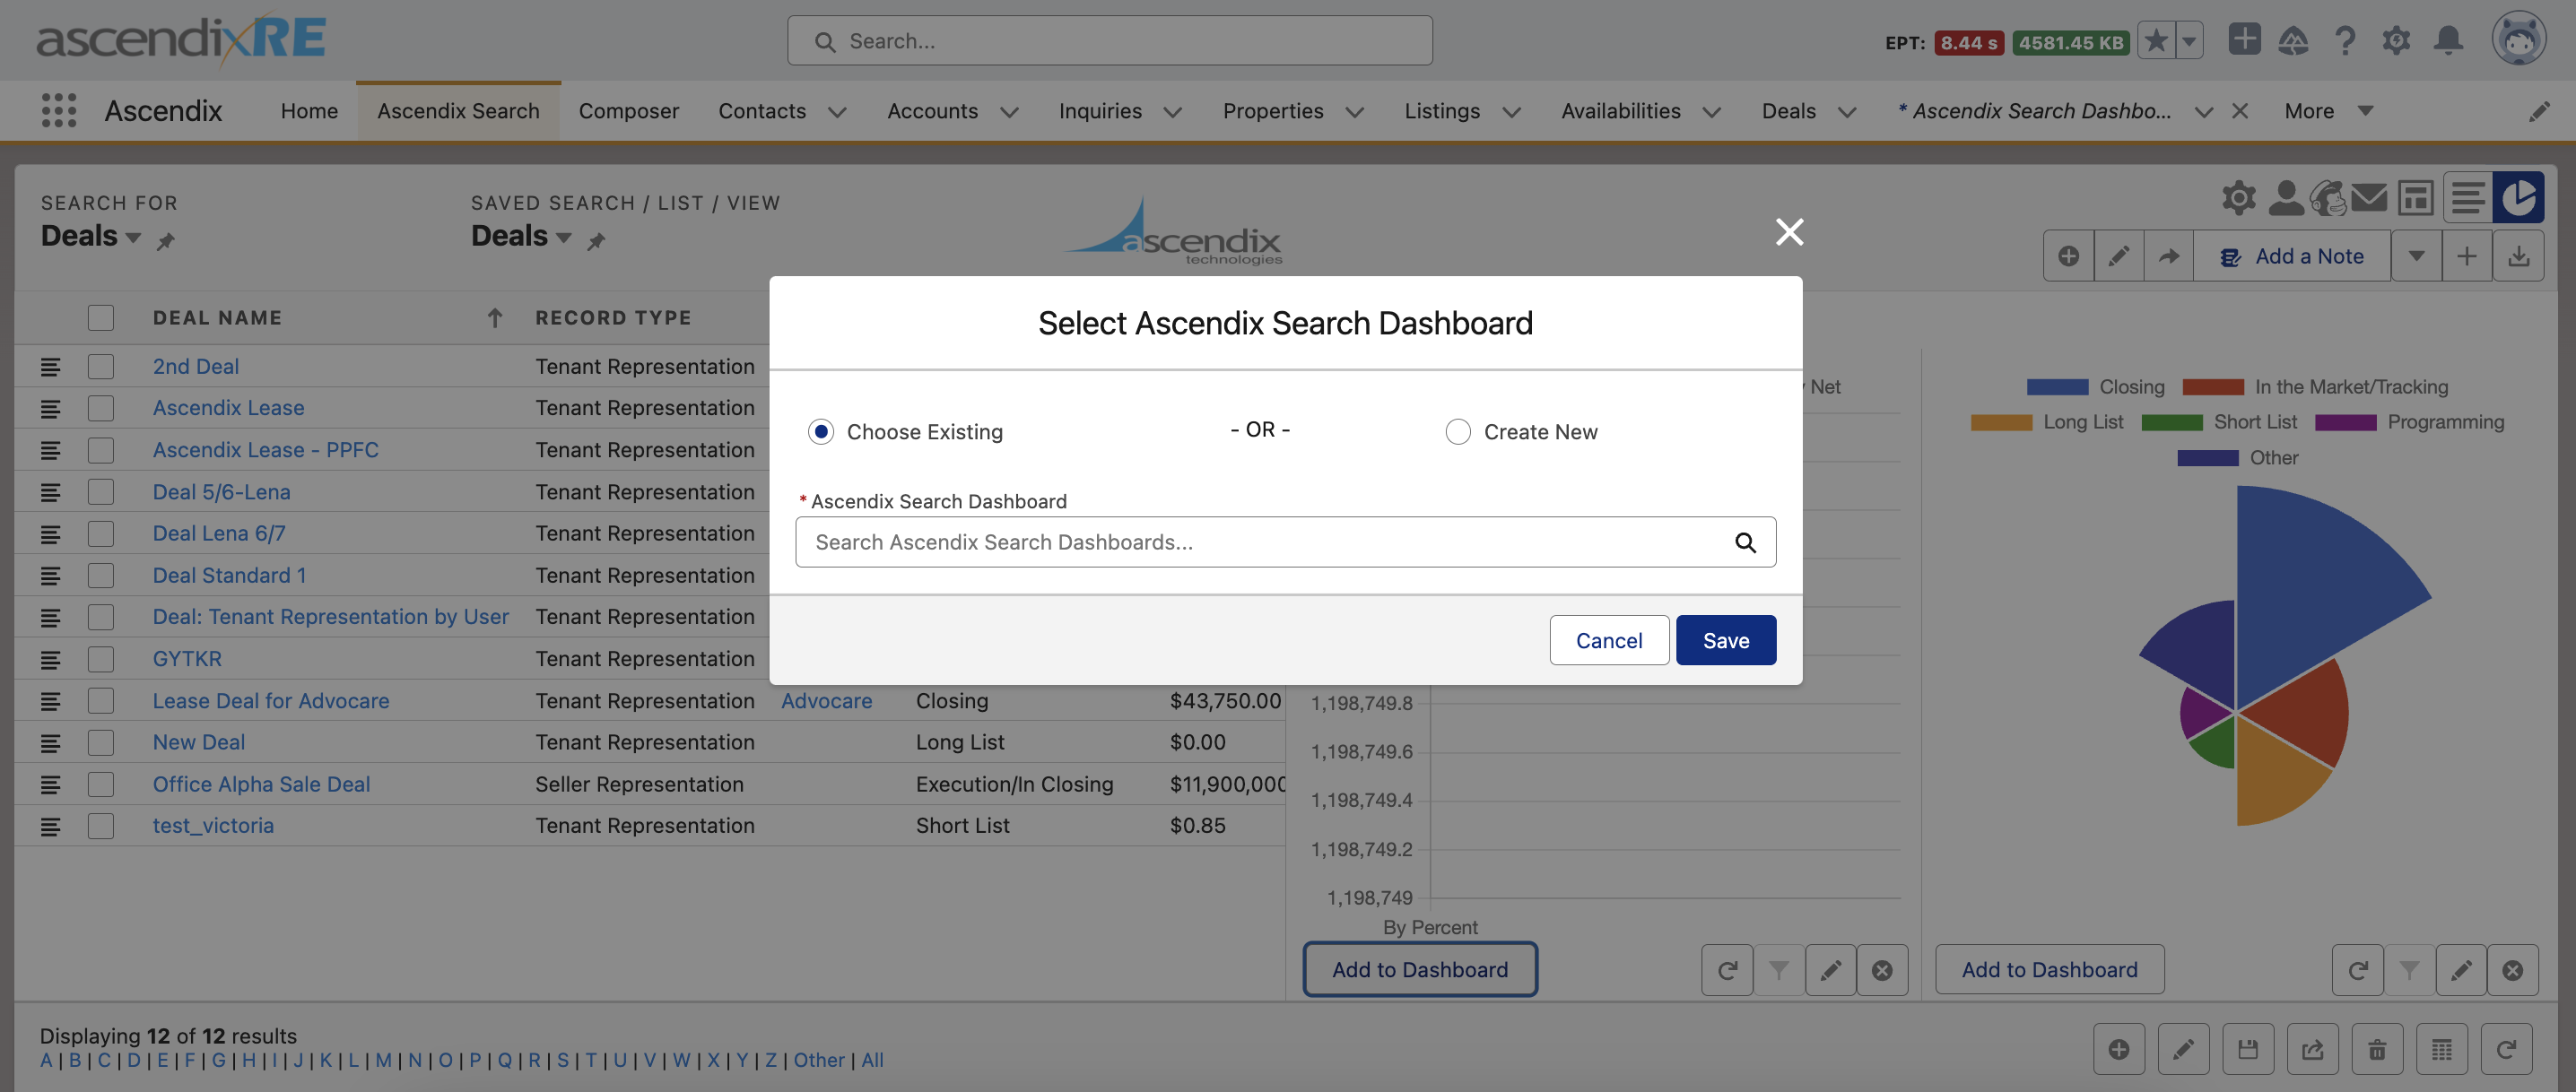
note: if you add a chart after a Saved search was created you need to save it once again in order for the chart to be linked to the given Saved search. - Click the Add to Dashboard button.
- Select Create New if this is your first Dashboard:

- Fill in the fields:
- Dashboard Name: Provide a unique and descriptive name for your Dashboard.
- Description: Provide a concise summary of the information and insights available on this Dashboard.
- If you have already created the Dashboard previously - Choose Existing.
- Start typing the name of the Dashboard in the look-up field.
- Hit the Save button to apply changes.
Dashboard Modes
- In Default mode, users can view the Dashboard and its widgets but cannot make changes.

- Name of the Dashboard: Shows the Dashboard's title.
- Description: Provides a brief overview of the Dashboard’s purpose.
- Pencil Icon: Used to switch to Edit mode.
- Refresh Icon: Allows users to refresh the data displayed.
- Arrow-down icon: Allows the user to perform actions:
- New : Create a fresh dashboard directly from the dropdown menu.
- Info: Display detailed information about the selected dashboard.
- Share: Grant viewing or editing permissions to other users using the share option.
- Delete: Remove a dashboard from the system using the delete action.

- Chart title: Shows a Chart's title.
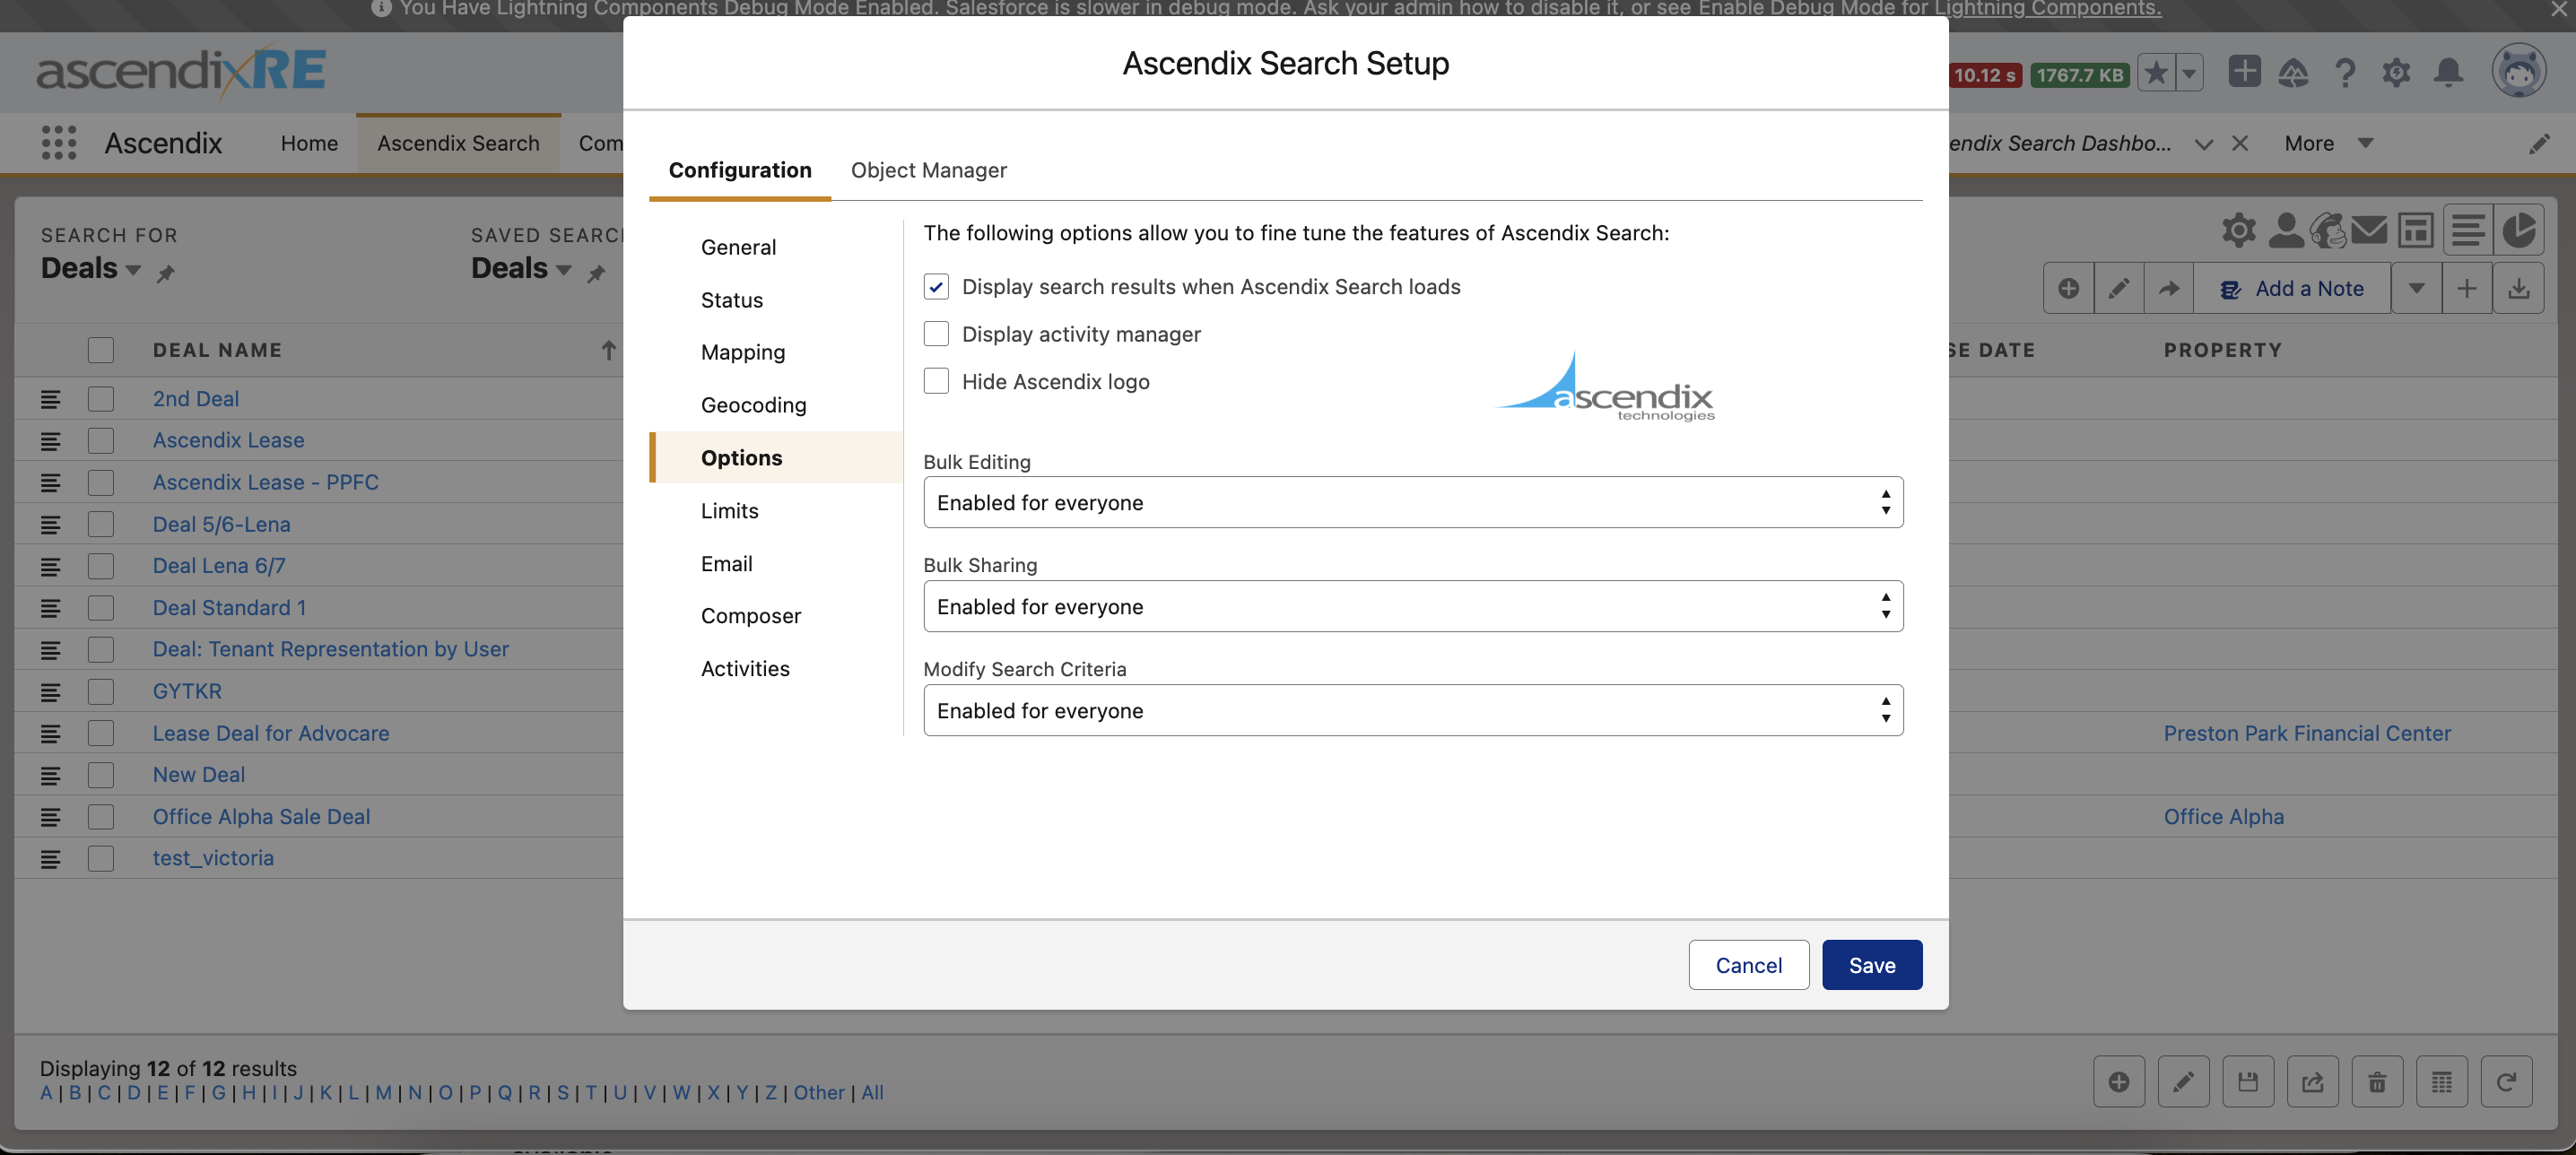
- Widget Display: Each widget features a "View Results" option. Clicking "View Results" redirects to the appropriate Search Results page.*
* - The checkbox Displays search results when Ascendix Search loads in Ascendix Search Setup is checked.
- Users can customize their Dashboards by dragging and dropping (reordering), adding, editing, or removing widgets in Edit Mode.

- Entering Edit Mode: Click the Edit icon (pencil) to switch to Edit mode.
- Customizing Dashboard: In Edit mode, widgets are visibly aligned up to a maximum of 6.
- If there are fewer than six widgets, empty slots display a "+Add a chart" option.
- Each widget shows: An edit icon (pencil) for customization.
- An "X" icon for removal: Clicking the "X" icon removes the widget immediately.
- Saving Changes: simply switch to View mode by clicking on corresponding icon to save the applied changes.

Add a Chart to the Ascendix Search Dashboard:
- Click the + Add Chart button to open the New Chart modal window.

- Select the following the Object from the Object Name dropdown.
- Select Search: Use the dropdown to select Saved Searches/List Views.
- Chart View: Select the options available.
- Function: Select the option available.
- Custom Title: You can override the Chart name if needed.
- Click the Save button to add a chart.
Dashboard Dropdown Menu
Purpose of the Dropdown Menu
The dropdown menu streamlines access to dashboards by organizing them into an intuitive, user-friendly interface. It helps users focus on key tasks without unnecessary clutter, enhancing overall productivity.
Features of the Dropdown
- Dashboard List: All accessible dashboards are listed in the dropdown, allowing users to switch between them seamlessly.
- Default Dashboard Selection: Dashboards are presented alphabetically in the dropdown, with the option to set a pinned dashboard for quick access.
- Status Indicator: A checkmark icon (✔) is displayed next to the currently active dashboard.
- Interactive Actions: Users can utilize dropdown options to manage dashboards, including creating, sharing, and deleting them, as permitted by their access levels.

Pinning Dashboards
Why Pin Dashboards?
Pinning allows you to quickly access important dashboards across sessions.
How to Pin/Unpin Dashboards
- Click the “Pin” icon located next to the dashboard name.

The pin ensures:
- Your dashboard remains easily accessible.
- It is available even after logging out and logging back in.
- To unpin, click the same “Pin” icon again.
Sharing Dashboards
How to Share Dashboards
- Click the Share Icon on the dashboard.
- A sharing dialog window will open:
- Adjust sharing settings and define the access level for the chosen users.
- Click “Save” to confirm the changes.

Note: Only users with sharing rights can share dashboards.
Visibility Settings
Users can create new Dashboards and specify their access levels, ensuring proper permissions and access control.
Admins will be able to see all dashboards presented due to the admin permission rights.
If the user does not have access to perform an action, the toast will be displayed.
