Ascendix Search app lets you visualize your search results with charts and graphs and use them in further search. Simply click on the charts to narrow down your search!
What is more, you can group your records by related objects. E.g., you can analyze your Contacts by Employee number from Accounts!
Here is how to create charts:
Step 1. From your search results select the pie chart icon Show/hide Insights at the top right of your search results.
Step 2. Now click on +Add a chart.
Step 3. Now select your chart type (doughnut, bar, pie, or line), what criteria you would like to group by, and the function type.
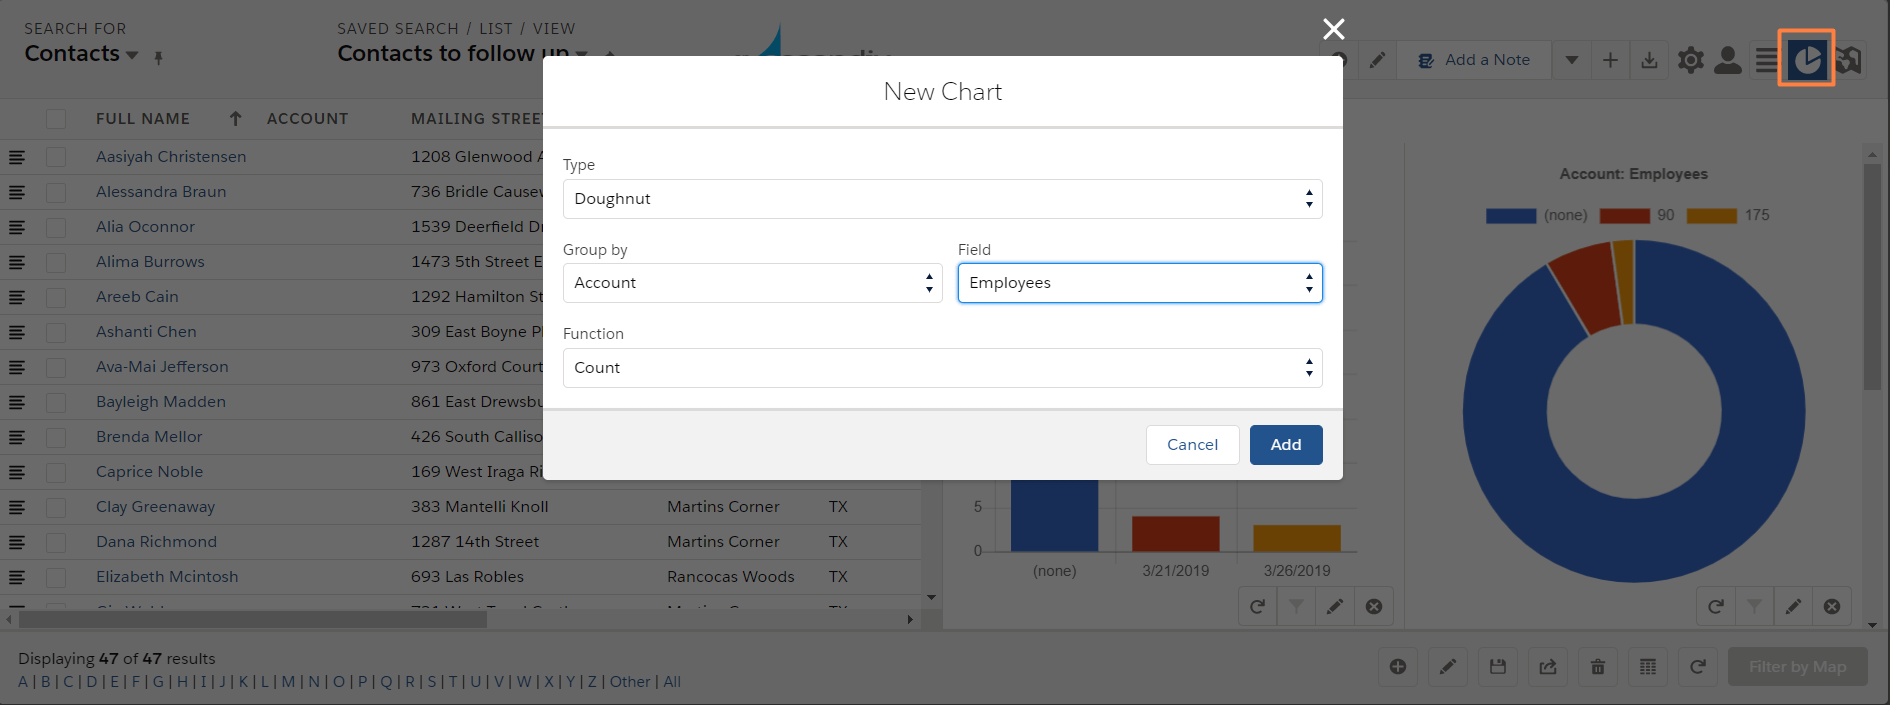
Ascendix Search - Adding New Chart Using Related Object
Congratulations! Now you have your chart set up. Now you can edit, refresh, or drill into the chart by clicking on the chart segment.
Make sure to save your search after adding charts to keep using them in the future.