A report is a list of records that satisfy the defined criteria. You can apply filters to reports on the fly, group and summarize your data, do calculations, visualize your data using charts, and easily add those charts to dashboards. Dashboards collect, organize, visualize, and highlight your key data so you can always stay up-to-date, focus on what’s important, and be productive no matter what.
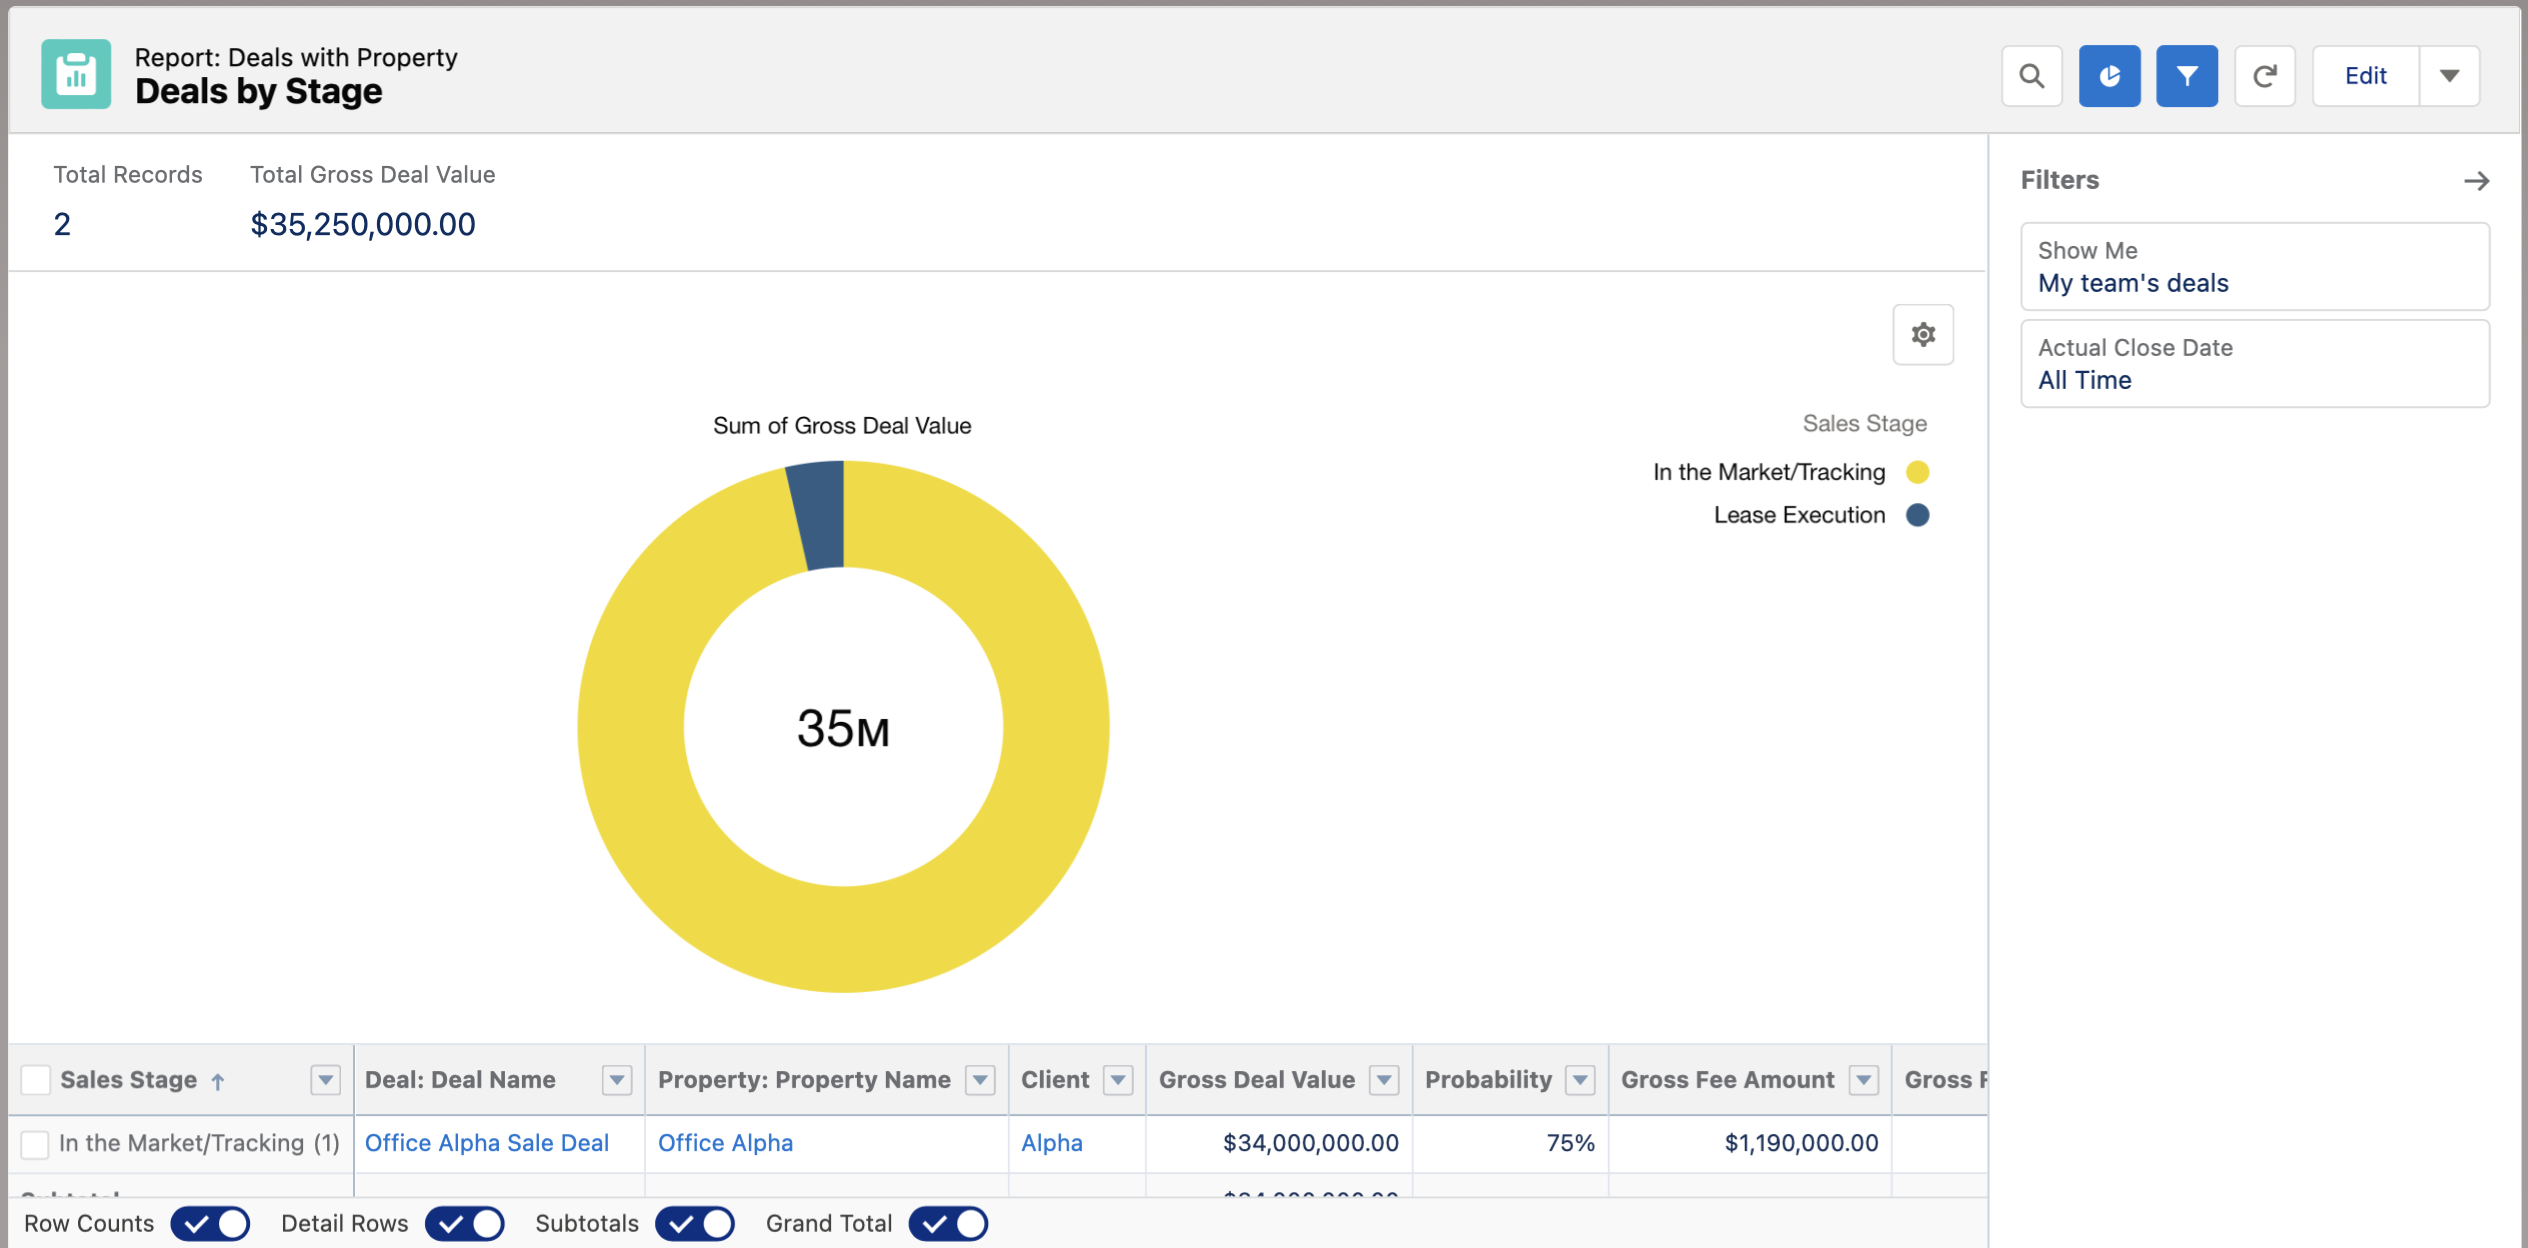
- Easily transform reports into visually appealing and easy-to-understand charts of all forms and types: bar, column, line, donut, funnel, scatter plot, you name it!
- Add your charts to dashboards, choose the best size for each chart, and position those charts on the dashboard in the way that best suits your needs